Comparing Twin Falls to Ohio State University
Twin Falls, Idaho, is my new home for the next five months while I work for Progressive Publishing, writing at the Progressive Dairyman website. I saw a population figure for Twin Falls that was close to that of Ohio State Univeristy's student populace, and figured that I should sit down and churn out a comparison.
| Ohio State University, Columbus, Ohio | Twin Falls, Idaho |
|---|---|
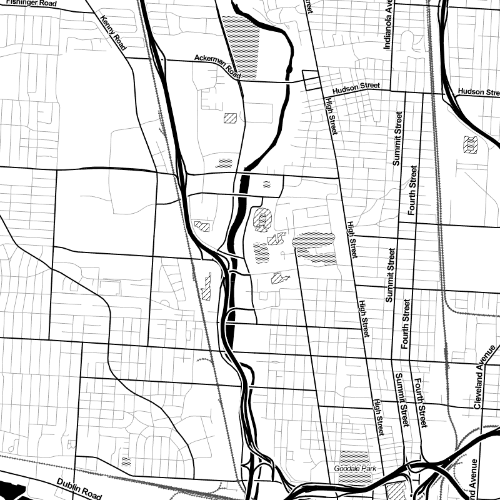
A map of Columbus, Ohio, centered on the Ohio State University campus. |
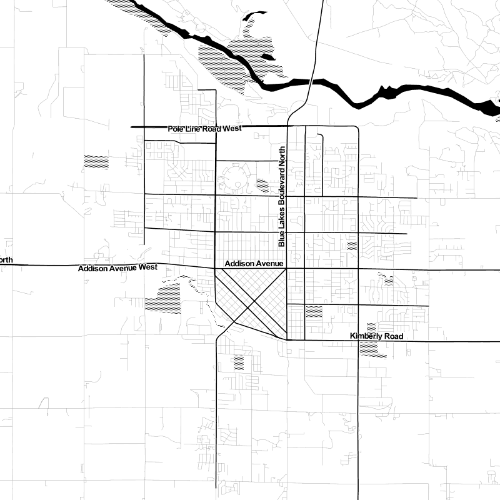
To the same scale as the Columbus map, Twin Falls, Idaho. |
|
44,201 Undergraduate students, 2013-2014 1 |
45,158 Total population, 2012 estimate 2 |
|
2.75 mi² Area of campus 3 |
18.16 mi² Area of city 4 |
|
$21,703/38,203 Ohio resident and nonresident tuition, fees, room and board, 2014-2015 5 |
$40,038 Median income in Twin Falls, 2009 6 |
I know, this isn't a fair comparison. Many of Ohio State's Columbus students live offcampus, but it is kind of interesting to see the difference side by side.
And because I kinda moved out here without really having researched the weather, here's the important meteorological comparisons:
| Columbus, Ohio | Twin Falls, Idaho |
|---|---|
| 56.11 inches Average yearly rainfall 7 | 9.36 inches Average yearly rainfall 8 |
|
|
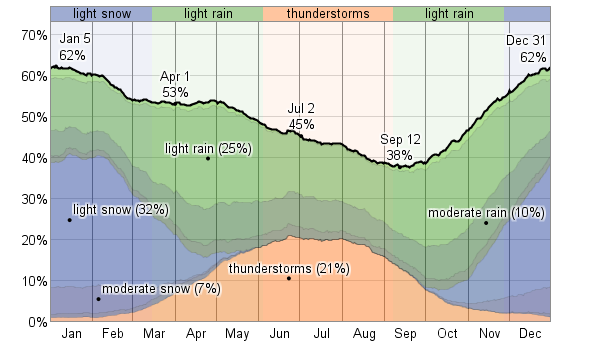
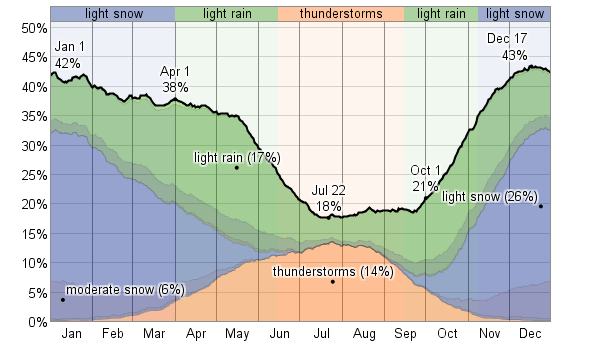
Don't let the matching proportions fool you: the scales are different, and Columbus is at least 38% likely to have precipitation, while Twin Falls is at most 43% likely. Columbus' minimum precipitation potential is only five points less than Twin Falls' maximum. I don't know how I feel about a summer without rain.
| Columbus, Ohio | Twin Falls, Idaho |
|---|---|
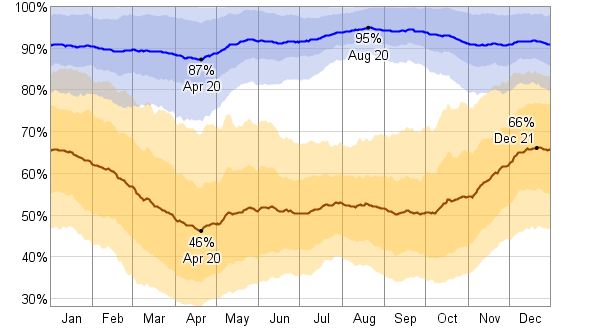
|
|
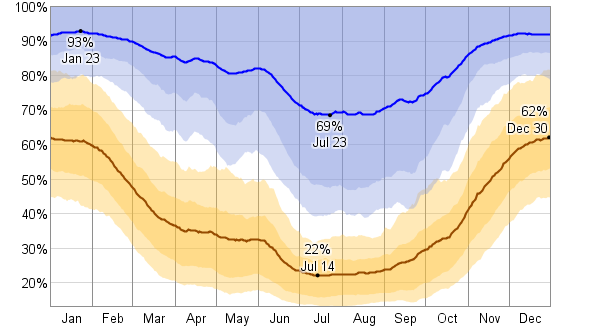
Columbus has much higher average high humidity (blue band) and low humidity (yellow band) than Twin Falls. I'm not complaining about Twin Falls' lack of mugginess.
| Columbus, Ohio | Twin Falls, Idaho |
|---|---|
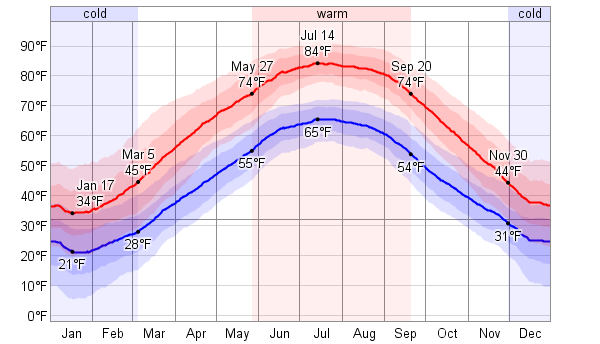
|
|
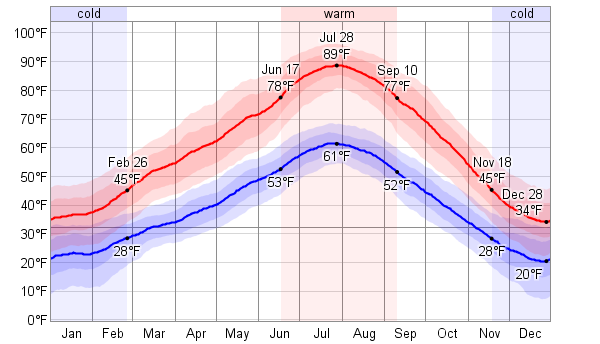
Columbus has higher average high temperatures than Twin Falls, but winter comes earlier in Idaho and is colder.
I'm looking forward to Twin Falls' autumn. It looks nice and dry.
Charts from Weatherspark.com. Maps from Stamen Design under CC BY 3.0, using OpenStreetMap data under CC BY SA 3.0.